Predicting Loan Defaulters: A Real-World Machine Learning Case Study Using Lending Club Data
Apache Spark is a cornerstone of modern big data analytics, providing a powerful framework for the efficient
processing and analysis of massive datasets to derive critical insights. Its core strength lies in a
distributed computing engine and a rich set of libraries designed to tackle large-scale data challenges.
A key component is MLlib, Spark's scalable machine learning library. It offers a comprehensive suite of algorithms for essential tasks like classification, regression, clustering, and collaborative filtering. This enables data scientists to build and train predictive models on vast amounts of data, powering applications such as fraud detection, customer churn prediction, and recommendation systems.
This project presents a comprehensive machine learning solution for predicting loan defaulters, utilizing the extensive and authentic Lending Club dataset. The case study focuses on building a robust classification system to assess borrower creditworthiness, demonstrating a complete workflow from data preprocessing and feature engineering to model development and evaluation. The insights derived aim to mirror real-world financial industry challenges, providing a tangible framework for intelligent credit risk mitigation.
In this analysis, we will leverage three classifiers from the MLlib library—Decision Tree, Random Forest, and Gradient-Boosted Trees (GBT to build a predictive model for loan defaults using the LendingClub dataset.
Classification problem and dataset used:
We will be using three classifiers to predict a loan default by users. For this, we will be using a real-world dataset provided by Lending Club. Lending Club is a fintech firm that has publicly available data on its website. If you are interested you can collect dataset from Kaggle from this link. Lending Club Dataset. The data is helpful for analytical studies and it contains hundreds of features. Looking into all the features is out of the scope of our study. Therefore, we will only use a subset of features for our predictions.
Here we will use Java 11 and IntelliJ IDEA for this project. Our essential Maven dependency commands of pom.xml are as following
    <dependencies>
        <dependency>
            <groupId>org.apache.spark</groupId>
            <artifactId>spark-core_2.12</artifactId>
            <version>3.5.0</version>
        </dependency>
        <dependency>
            <groupId>org.apache.spark</groupId>
            <artifactId>spark-sql_2.12</artifactId>
            <version>3.5.0</version>
        </dependency>
        <dependency>
            <groupId>org.apache.spark</groupId>
            <artifactId>spark-mllib_2.12</artifactId>
            <version>3.5.0</version>
        </dependency>
        <dependency>
            <groupId>org.jfree</groupId>
            <artifactId>jfreechart</artifactId>
            <version>1.5.3</version>
        </dependency>
    </dependencies>
1. Import libraries
    import org.apache.spark.api.java.JavaRDD;
    import org.apache.spark.api.java.JavaSparkContext;
    import org.apache.spark.broadcast.Broadcast;
    import org.apache.spark.ml.Pipeline;
    import org.apache.spark.ml.PipelineModel;
    import org.apache.spark.ml.PipelineStage;
    import org.apache.spark.ml.classification.DecisionTreeClassifier;
    import org.apache.spark.ml.classification.GBTClassifier;
    import org.apache.spark.ml.classification.RandomForestClassifier;
    import org.apache.spark.ml.evaluation.MulticlassClassificationEvaluator;
    import org.apache.spark.ml.feature.*;
    import org.apache.spark.ml.param.ParamMap;
    import org.apache.spark.ml.tuning.CrossValidator;
    import org.apache.spark.ml.tuning.CrossValidatorModel;
    import org.apache.spark.ml.tuning.ParamGridBuilder;
    import org.apache.spark.mllib.evaluation.MulticlassMetrics;
    import org.apache.spark.mllib.linalg.Matrix;
    import org.apache.spark.sql.*;
    import org.jfree.chart.ChartFactory;
    import org.jfree.chart.ChartFrame;
    import org.jfree.chart.ChartPanel;
    import org.jfree.chart.JFreeChart;
    import org.jfree.chart.plot.PlotOrientation;
    import org.jfree.chart.plot.XYPlot;
    import org.jfree.chart.renderer.xy.XYDotRenderer;
    import org.jfree.data.category.DefaultCategoryDataset;
    import org.jfree.data.general.DefaultPieDataset;
    import org.jfree.data.general.PieDataset;
    import org.jfree.data.statistics.BoxAndWhiskerItem;
    import org.jfree.data.statistics.DefaultBoxAndWhiskerCategoryDataset;
    import org.jfree.data.statistics.HistogramDataset;
    import org.jfree.data.statistics.HistogramType;
    import org.jfree.data.xy.XYSeries;
    import org.jfree.data.xy.XYSeriesCollection;
    import scala.Tuple2;

    import javax.swing.*;
    import java.awt.*;
    import java.util.*;
    import java.util.List;

    import static org.apache.spark.sql.functions.col;
    import static org.apache.spark.sql.functions.count;
    import static org.apache.spark.sql.functions.when;
    import static org.apache.spark.sql.functions.isnan;
    import static org.apache.spark.sql.functions.sum;
    import static org.apache.spark.sql.functions.lit;
    import static org.apache.spark.sql.functions.regexp_extract;
    import static org.apache.spark.sql.functions.rand;
    import static org.apache.spark.sql.functions.desc;
At first we ingest the data that we want to analyze. The data is brought from external sources or systems where it resides into data exploration and modeling environment. The data exploration and modeling environment is Spark. Firstly we need to make sure our source of data that is our dataset files are present in HDFS where we expect to read them from our spark jobs. To put the files in HDFS first bring the files to the operating system i.e. Linux in our case and from Linux we copy them to HDFS using the following command
2. Create Spark Session
        SparkSession spark = SparkSession.builder()
                .appName("LandClubClassification")
                .master("local[*]")
                .config("spark.sql.shuffle.partitions", "100")
                .getOrCreate();
3. Load Data
We will first load dataset using Apache Spark and see the total numbers of rows and columns, and first 5 rows of our dataset. For these our lines of codes are shown bellow
    String fileLocation = "hdfs://localhost:9000/user/hduser/data/accepted_2007_to_2018Q4.csv.gz";
        // Selected columns
        String[] selectedColumns = {
                "id",
                "purpose",
                "term",
                "verification_status",
                "acc_now_delinq",
                "addr_state",
                "annual_inc",
                "application_type",
                "dti",
                "grade",
                "home_ownership",
                "initial_list_status",
                "installment",
                "int_rate",
                "loan_amnt",
                "funded_amnt",
                "loan_status",
                "tax_liens",
                "delinq_amnt",
                "policy_code",
                "last_fico_range_high",
                "last_fico_range_low",
                "recoveries",
                "collection_recovery_fee"
        };
        Dataset<Row> df = spark.read()
                .format("csv")
                .option("inferSchema", "true")
                .option("header", "true")
                .option("sep", ",")
                .load(fileLocation)
                .selectExpr(selectedColumns);  // select columns

        df.show(5);
        System.out.println("Shape of the Dataset:" + "\n" + "Rows = " + df.count() + "\n" + "Columns = " + df.columns().length);
Output:
    +--------+------------------+----------+-------------------+--------------+----------+----------+----------------+-----+-----+--------------+-------------------+-----------+--------+---------+-----------+-----------+---------+-----------+-----------+--------------------+-------------------+----------+-----------------------+
    |      id|           purpose|      term|verification_status|acc_now_delinq|addr_state|annual_inc|application_type|  dti|grade|home_ownership|initial_list_status|installment|int_rate|loan_amnt|funded_amnt|loan_status|tax_liens|delinq_amnt|policy_code|last_fico_range_high|last_fico_range_low|recoveries|collection_recovery_fee|
    +--------+------------------+----------+-------------------+--------------+----------+----------+----------------+-----+-----+--------------+-------------------+-----------+--------+---------+-----------+-----------+---------+-----------+-----------+--------------------+-------------------+----------+-----------------------+
    |68407277|debt_consolidation| 36 months|       Not Verified|           0.0|        PA|   55000.0|      Individual| 5.91|    C|      MORTGAGE|                  w|     123.03|   13.99|   3600.0|     3600.0| Fully Paid|      0.0|        0.0|        1.0|               564.0|              560.0|       0.0|                    0.0|
    |68355089|    small_business| 36 months|       Not Verified|           0.0|        SD|   65000.0|      Individual|16.06|    C|      MORTGAGE|                  w|     820.28|   11.99|  24700.0|    24700.0| Fully Paid|      0.0|        0.0|        1.0|               699.0|              695.0|       0.0|                    0.0|
    |68341763|  home_improvement| 60 months|       Not Verified|           0.0|        IL|   63000.0|       Joint App|10.78|    B|      MORTGAGE|                  w|     432.66|   10.78|  20000.0|    20000.0| Fully Paid|      0.0|        0.0|        1.0|               704.0|              700.0|       0.0|                    0.0|
    |66310712|debt_consolidation| 60 months|    Source Verified|           0.0|        NJ|  110000.0|      Individual|17.06|    C|      MORTGAGE|                  w|      829.9|   14.85|  35000.0|    35000.0|    Current|      0.0|        0.0|        1.0|               679.0|              675.0|       0.0|                    0.0|
    |68476807|    major_purchase| 60 months|    Source Verified|           0.0|        PA|  104433.0|      Individual|25.37|    F|      MORTGAGE|                  w|     289.91|   22.45|  10400.0|    10400.0| Fully Paid|      0.0|        0.0|        1.0|               704.0|              700.0|       0.0|                    0.0|
    +--------+------------------+----------+-------------------+--------------+----------+----------+----------------+-----+-----+--------------+-------------------+-----------+--------+---------+-----------+-----------+---------+-----------+-----------+--------------------+-------------------+----------+-----------------------+
    only showing top 5 rows

    Shape of the Dataset:
    Rows = 2260701
    Columns = 24
4. Data Exploration
Missing Values
        List<Column> nullCounts = new ArrayList<>();
        for (String colName : df.columns()) {
            nullCounts.add(sum(when(col(colName).isNull(), 1).otherwise(0)).alias(colName));
        }

        df.select(nullCounts.toArray(new Column[0])).show();
Output:
     +---+-------+----+-------------------+--------------+----------+----------+----------------+----+-----+--------------+-------------------+-----------+--------+---------+-----------+-----------+---------+-----------+-----------+--------------------+-------------------+----------+-----------------------+
    | id|purpose|term|verification_status|acc_now_delinq|addr_state|annual_inc|application_type| dti|grade|home_ownership|initial_list_status|installment|int_rate|loan_amnt|funded_amnt|loan_status|tax_liens|delinq_amnt|policy_code|last_fico_range_high|last_fico_range_low|recoveries|collection_recovery_fee|
    +---+-------+----+-------------------+--------------+----------+----------+----------------+----+-----+--------------+-------------------+-----------+--------+---------+-----------+-----------+---------+-----------+-----------+--------------------+-------------------+----------+-----------------------+
    |  0|     34|  33|                 33|           221|        34|        37|              88|1745|   33|            33|                 50|         33|      33|       33|         33|         33|      338|        258|         99|                  76|                 68|        35|                     39|
    +---+-------+----+-------------------+--------------+----------+----------+----------------+----+-----+--------------+-------------------+-----------+--------+---------+-----------+-----------+---------+-----------+-----------+--------------------+-------------------+----------+-----------------------+
Drop rows with any null/NaN value
df = df.na().drop();
Group by ‘purpose’ and count the occurrences
    Dataset<Row> dfWithCount = df.groupBy("purpose").count();
    dfWithCount.show();
Output:
    +------------------+-------+
    |           purpose|  count|
    +------------------+-------+
    |debt_consolidation|1276774|
    |       credit_card| 516570|
    |            moving|  15369|
    |           wedding|   2351|
    |          vacation|  15518|
    |       educational|    404|
    |  renewable_energy|   1444|
    |             house|  14119|
    |               car|  23996|
    |    major_purchase|  50400|
    |             other| 139270|
    |           medical|  27453|
    |    small_business|  24638|
    |  home_improvement| 150290|
    +------------------+-------+
Replacing values in the ‘purpose’ column based on the ‘count’ column condition If ‘count’ is less than 300, set ‘purpose’ to “other”, else keep the original ‘purpose’
    Dataset<Row> dfCountRenamed = dfWithCount.withColumnRenamed("purpose", "purpose_count");

    Dataset<Row> joined = df.join(
            dfCountRenamed,
            df.col("purpose").equalTo(dfCountRenamed.col("purpose_count")),
            "left"
    );
    Dataset<Row> updated = joined
            .withColumn(
                    "purpose",
                    when(col("count").lt(300), lit("other")).otherwise(col("purpose"))
            )
            .drop("count")
            .drop("purpose_count");
    updated.select("purpose").distinct().show();
Output:
    +------------------+
    |           purpose|
    +------------------+
    |           wedding|
    |       educational|
    |             other|
    |    small_business|
    |debt_consolidation|
    |       credit_card|
    |            moving|
    |          vacation|
    |  renewable_energy|
    |             house|
    |               car|
    |    major_purchase|
    |           medical|
    |  home_improvement|
    +------------------+
Group by ‘term’ and count the occurrences
    Dataset<Row> termCounts = updated.groupBy("term").count();
    termCounts.show();
Output:
    +----------+-------+
    |      term|  count|
    +----------+-------+
    | 36 months|1608405|
    | 60 months| 650191|
    +----------+-------+
Applying a regular expression to extract numbers from the ‘term’ column and then casting it to the Integer data type.
    Dataset<Row> updated1 = updated.withColumn(
            "term",
            regexp_extract(col("term"), "(\\d+)", 0).cast("int")
    );
Group by 'verification_status' and count the occurrences.
    Dataset<Row> verification_statusCount = updated1.groupBy("verification_status").count();
    verification_statusCount.show();
Output:
    +-------------------+------+
    |verification_status| count|
    +-------------------+------+
    |           Verified|629395|
    |    Source Verified|886141|
    |       Not Verified|743060|
    +-------------------+------+
Encode ‘verification_status’ column values into a new column ‘verification_status_encoded’ If ‘verification_status’ is either “Verified” or “Source Verified”, set ‘verification_status_encoded’ to 0 Otherwise, set it to 1
    Dataset<Row> updated2 = updated1.withColumn(
            "verification_status_encoded",
            when(
                    col("verification_status").isin("Verified", "Source Verified"),
                    0
            ).otherwise(1)
    ).drop("verification_status");

    updated2.groupBy("verification_status_encoded").count().show();
Output:
    +---------------------------+-------+
    |                          1| 743060|
    |                          0|1515536|
    +---------------------------+-------+
Group by ‘acc_now_delinq’ and count the occurrences
updated2.groupBy("acc_now_delinq").count().show();
Output:
    +--------------+-------+
    |acc_now_delinq|  count|
    +--------------+-------+
    |           1.0|   8290|
    |           0.0|2249817|
    |          14.0|      1|
    |           5.0|      3|
    |           6.0|      2|
    |           4.0|     11|
    |           7.0|      1|
    |           2.0|    421|
    |           3.0|     50|
    +--------------+-------+
Define the valid values for 'acc_now_delinq' valid_values = [0, 1, 2, 3, 4, 5, 6, 7, 8, 9, 10]
Modify the 'acc_now_delinq' column: 1. Cast the column to IntegerType 2. Set values greater than or
equal to 4 to 4, and keep other valid values as they are
Define the valid values for ‘acc_now_delinq’
valid_values = [0, 1, 2, 3, 4, 5, 6, 7, 8, 9, 10]
Modify the ‘acc_now_delinq’ column:
- Cast the column to IntegerType
- Set values greater than or equal to 4 to 4, and keep other valid values as they are
    List<Integer> validValues = Arrays.asList(0, 1, 2, 3, 4, 5, 6, 7, 8, 9, 10);
    // Transform and filter the DataFrame
    Dataset<Row> updated3 = updated2
            .withColumn("acc_now_delinq", col("acc_now_delinq").cast("int"))
            .withColumn("acc_now_delinq",
                    when(col("acc_now_delinq").geq(4), 4)
                            .otherwise(col("acc_now_delinq"))
            )
            .filter(col("acc_now_delinq").isin(validValues.toArray(new Integer[0])));

    // Group by and show the count
    updated3.groupBy("acc_now_delinq").count().show();
Output:
    +--------------+-------+
    |acc_now_delinq|  count|
    +--------------+-------+
    |             1|   8290|
    |             3|     50|
    |             4|     18|
    |             2|    421|
    |             0|2249817|
    +--------------+-------+
Group by ‘application_type’ and count the occurrences
updated3.groupBy("application_type").count().show();
Output:
    +----------------+-------+
    |application_type|  count|
    +----------------+-------+
    |       Joint App| 118999|
    |      Individual|2139597|
    +----------------+-------+
Define the valid values for ‘application_type’ valid_values = [‘Joint App’, ‘Individual’]
Modify the ‘application_type’ column:
- Map ‘Joint App’ to 0 and ‘Individual’ to 1
- Remove other values
- Cast the column to IntegerType
    // Define valid values
    List<String>> valid_Values = Arrays.asList("Joint App", "Individual");
    // Apply transformations
    updated3 = updated3.withColumn("application_type",
            when(col("application_type").equalTo("Joint App"), 0)
                    .when(col("application_type").equalTo("Individual"), 1)
                    .otherwise(null)
    );
    // Filter out null values and cast to Integer
    updated3 = updated3.filter(col("application_type").isNotNull())
            .withColumn("application_type", col("application_type").cast("int"));
Group by ‘grade’ and count the occurrences
updated3.groupBy("grade").count().show();
Output:
    +-----+------+
    |grade| count|
    +-----+------+
    |    F| 41758|
    |    E|135506|
    |    B|663013|
    |    D|324042|
    |    C|649471|
    |    A|432662|
    |    G| 12144|
    +-----+------+
5. Data visualization.
Reduce the data size for visualization to fasten following steps, otherwise the memory will soon run out.
    Dataset<Row> filteredDF = updated3.orderBy(rand()).limit(100000);

    // Optionally, cache the sampled DataFrame for faster reuse
    filteredDF.cache();
Target feature:
The loan_status feature, which is our target variable, contains other values than Fully Paid and Charged Off.
Therefore, we consider to encode all. Inspecting “loan_status” column unique values
filteredDF.groupBy("loan_status").count().show();
Output:
    +--------------------+-----+
    |         loan_status|count|
    +--------------------+-----+
    |          Fully Paid|47352|
    |  Late (31-120 days)|  940|
    |             Current|39132|
    |         Charged Off|11865|
    |     In Grace Period|  347|
    |Does not meet the...|   94|
    |   Late (16-30 days)|  217|
    |Does not meet the...|   51|
    |             Default|    2|
    +--------------------+-----+
Current: Applicant is in the process of paying the instalments, i.e. the tenure of the loan is not yet completed. These candidates are not labelled as ‘defaulted’. Dropping the current customers as they are not required for driving factors consideration. Also id column is not required.
    // Drop rows where loan_status is 'Current'
    Dataset<Row> filteredDFWithoutCurrent = filteredDF.filter(col("loan_status").notEqual("Current"));

    // Group by loan_status and count
    Dataset<Row> statusCounts = filteredDFWithoutCurrent.groupBy("loan_status").count();
    // Show the result
    statusCounts.show();
Output:
    +--------------------+-----+
    |         loan_status|count|
    +--------------------+-----+
    |          Fully Paid|47825|
    |         Charged Off|11903|
    |     In Grace Period|  379|
    |  Late (31-120 days)|  969|
    |   Late (16-30 days)|  210|
    |Does not meet the...|   85|
    |Does not meet the...|   31|
    |             Default|    2|
    +--------------------+-----+
Define 'Good Loan' and 'Bad Loan' statuses.
    JavaSparkContext jsc = new JavaSparkContext(spark.sparkContext());
    List<String> goodLoanStatuses = Arrays.asList(
            "Fully Paid",
            "In Grace Period",
            "Does not meet the credit policy. Status:Fully Paid"
    );
    Set<String> goodLoanSet = new HashSet<>(goodLoanStatuses);
    Broadcast<Set<String>> broadcastGoodLoanSet = jsc.broadcast(goodLoanSet);

    Dataset<Row> filtered_DF = filteredDFWithoutCurrent.withColumn(
            "loan_status",
            when(col("loan_status").isin(goodLoanStatuses.toArray(new String[0])), "Good Loan")
                    .otherwise("Bad Loan")
    );
    filtered_DF.select("loan_status").distinct().show(false);
Output:
    +-----------+
    |loan_status|
    +-----------+
    |Good Loan  |
    |Bad Loan   |
    +-----------+
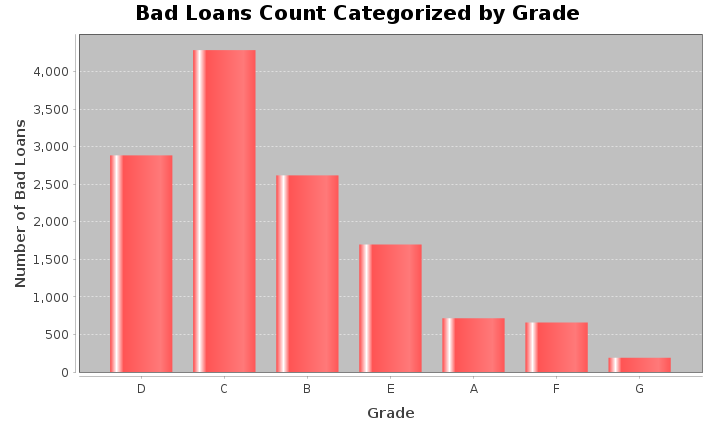
    Dataset<Row> loanGrade = filtered_DF
            .filter(col("loan_status").notEqual("Good Loan"))
            .groupBy("grade")
            .count()
            .withColumnRenamed("count", "bad_loan_count");

    List<Row> rows = loanGrade.collectAsList();
    DefaultCategoryDataset dataset = new DefaultCategoryDataset();
    for (Row row : rows) {
        String grade = row.getAs("grade");
        long count = row.getAs("bad_loan_count");
        dataset.addValue(count, "Bad Loans", grade);
    }
    JFreeChart chart = ChartFactory.createBarChart(
            "Bad Loans Count Categorized by Grade",
            "Grade",
            "Number of Bad Loans",
            dataset,
            PlotOrientation.VERTICAL,
            false,
            true,
            false
    );
    ChartFrame frame = new ChartFrame("Bad Loans by Grade", chart);
    frame.pack();
    frame.setVisible(true);

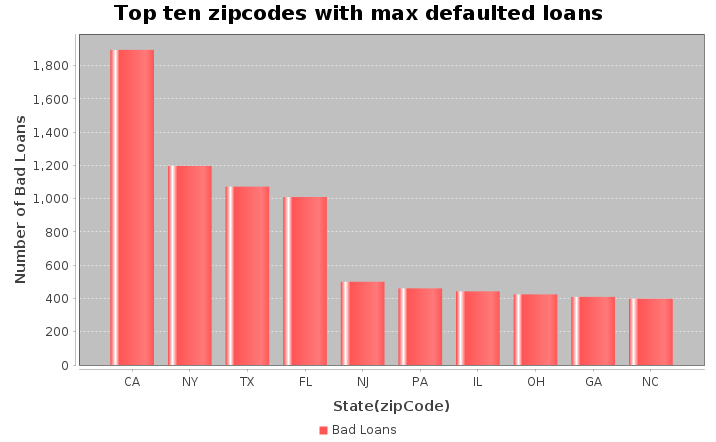
    Dataset<Row> loanAmtDF = filtered_DF
            .filter(col("loan_status").notEqual("Good Loan"))
            .groupBy("addr_state")
            .agg(count("*").alias("loanCount"))
            .withColumnRenamed("addr_state", "State")
            .orderBy(desc("loanCount"))
            .limit(10);
    List<Row> topStates = loanAmtDF.collectAsList();
    DefaultCategoryDataset dataset = new DefaultCategoryDataset();
    for (Row row : topStates) {
        dataset.addValue(row.getLong(1), "Bad Loans", row.getString(0));
    }
    JFreeChart chart = ChartFactory.createBarChart(
            "Top ten zipcodes with max defaulted loans",
            "State(zipCode)",
            "Number of Bad Loans",
            dataset
    );
    JFrame frame = new JFrame("Loan Analysis");
    frame.setDefaultCloseOperation(JFrame.EXIT_ON_CLOSE);
    frame.add(new ChartPanel(chart));
    frame.pack();
    frame.setVisible(true);
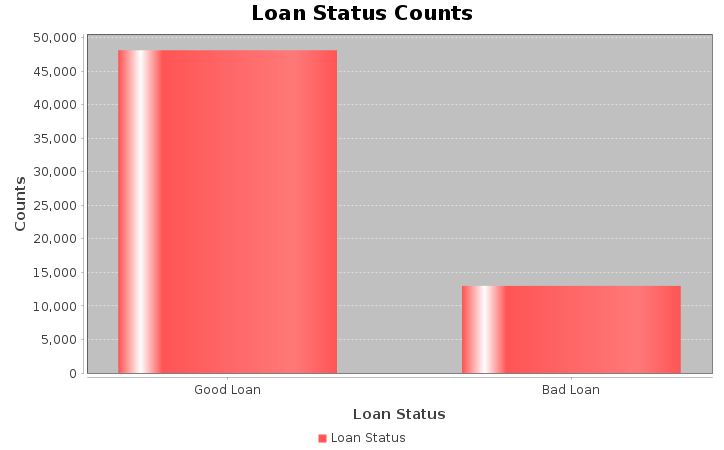
    // Perform the aggregation and filtering
    Dataset<Row> loanStat = filtered_DF
            .groupBy("loan_status")
            .count()
            .filter(col("loan_status").isin("Good Loan", "Bad Loan"));

    // Collect the results to the driver as a list of Rows
    List<Row> loanStatList = loanStat.collectAsList();
    // Create a dataset for the chart
    DefaultCategoryDataset dataset = new DefaultCategoryDataset();
    for (Row row : loanStatList) {
        dataset.addValue(row.getLong(1), "Loan Status", row.getString(0));
    }

    // Create the chart
    JFreeChart chart = ChartFactory.createBarChart(
            "Loan Status Counts",
            "Loan Status",
            "Counts",
            dataset
    );

    // Display the chart in a JFrame
    JFrame frame = new JFrame("Loan Status Analysis");
    frame.setDefaultCloseOperation(JFrame.EXIT_ON_CLOSE);
    frame.add(new ChartPanel(chart));
    frame.pack();
    frame.setVisible(true);
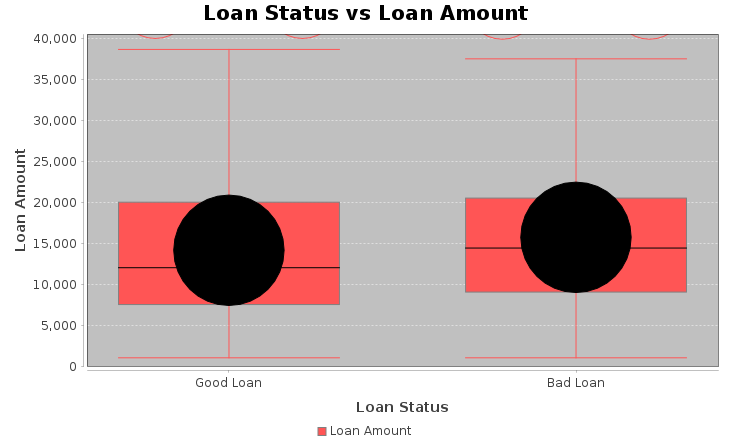
    // Loan Status vs Loan Amount
    Dataset<Row> pdf = filtered_DF.select("loan_amnt", "loan_status");

    // Lists for good/bad loans
    List<Double> goodLoans = new ArrayList<>();
    List<Double> badLoans = new ArrayList<>();

    for (Row r : pdf.collectAsList()) {
        double loanAmt = r.getAs("loan_amnt");
        String status = r.getAs("loan_status");

        if ("Good Loan".equals(status)) {
            goodLoans.add(loanAmt);
        } else if ("Bad Loan".equals(status)) {
            badLoans.add(loanAmt);
        }
    }
    DefaultBoxAndWhiskerCategoryDataset dataset = new DefaultBoxAndWhiskerCategoryDataset();

    dataset.add(goodLoans, "Loan Amount", "Good Loan");
    dataset.add(badLoans, "Loan Amount", "Bad Loan");

    JFreeChart chart = ChartFactory.createBoxAndWhiskerChart(
            "Loan Status vs Loan Amount",
            "Loan Status",
            "Loan Amount",
            dataset,
            true
    );

    // Display chart in window
    javax.swing.JFrame frame = new javax.swing.JFrame("Boxplot");
    frame.setContentPane(new ChartPanel(chart));
    frame.setSize(730, 480);
    frame.setVisible(true);
    frame.setDefaultCloseOperation(javax.swing.JFrame.EXIT_ON_CLOSE);
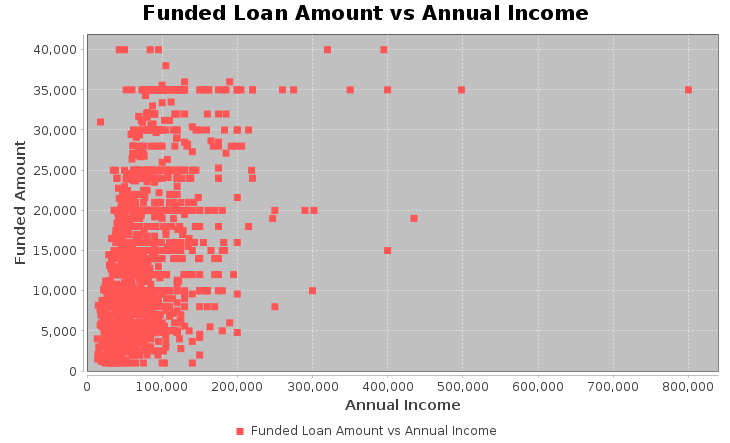
    Dataset<Row> filtered_df = filtered_DF.orderBy(rand()).limit(1500);
    Dataset<Row> df1 = filtered_df
            .withColumn("annual_inc", filteredDF.col("annual_inc").cast("double"))
            .withColumn("funded_amnt", filteredDF.col("funded_amnt").cast("double"));

    // Collect rows
    List<Row> rows = df1.select("annual_inc", "funded_amnt").collectAsList();

    XYSeries series = new XYSeries("Funded Loan Amount vs Annual Income");

    for (Row row : rows) {

        // Avoid NullPointerException
        if (row.isNullAt(0) || row.isNullAt(1)) {
            continue;
        }

        double annualInc  = row.getDouble(0);
        double fundedAmt  = row.getDouble(1);

        series.add(annualInc, fundedAmt);
    }

    XYSeriesCollection dataset = new XYSeriesCollection();
    dataset.addSeries(series);

    // Create scatter plot
    JFreeChart chart = ChartFactory.createScatterPlot(
            "Funded Loan Amount vs Annual Income",
            "Annual Income",
            "Funded Amount",
            dataset
    );

    // Display
    ChartFrame frame = new ChartFrame("Scatter Plot", chart);
    frame.pack();
    frame.setSize(730, 480);
    frame.setVisible(true);
6. Feature Engineering, Transformation and Data Preparation for Modeling.
StringIndexer to convert ‘grade’ column into numerical indices
    StringIndexer gradeIndexer = new StringIndexer()
            .setInputCol("grade")
            .setOutputCol("grade_index")
            .setStringOrderType("alphabetAsc");
    StringIndexerModel gradeIndexerModel = gradeIndexer.fit(updated3);
    Dataset <Row> transformedDF = gradeIndexerModel.transform(updated3).drop("grade");
Now we create oneHotEncodeColumn method from a static context.
    public static Dataset<Row> oneHotEncodeColumn(Dataset<Row> df, String inputCol) {
        // Step 1: StringIndexer
        StringIndexer indexer = new StringIndexer()
                .setInputCol(inputCol)
                .setOutputCol(inputCol + "_indexed");

        StringIndexerModel indexerModel = indexer.fit(df);
        Dataset<Row> indexedDF = indexerModel.transform(df);

        // Step 2: OneHotEncoder
        OneHotEncoder encoder = new OneHotEncoder()
                .setInputCol(inputCol + "_indexed")
                .setOutputCol(inputCol + "_encoded");

        OneHotEncoderModel encoderModel = encoder.fit(indexedDF);
        Dataset<Row> encodedDF = encoderModel.transform(indexedDF);

        // Step 3: Drop the original and indexed columns
        encodedDF = encodedDF.drop(inputCol, inputCol + "_indexed");

        return encodedDF;
    }
One Hot Encoder
    List<String> columnsToEncode = Arrays.asList("purpose", "addr_state", "home_ownership", "initial_list_status");

    for (String column : columnsToEncode) {
        transformedDF = oneHotEncodeColumn(transformedDF, column);
    }
Cast to float type
    List<String> columnsToCast = Arrays.asList(
            "installment",
            "int_rate",
            "loan_amnt",
            "annual_inc",
            "funded_amnt",
            "dti",
            "tax_liens",
            "delinq_amnt",
            "policy_code",
            "last_fico_range_high",
            "last_fico_range_low",
            "recoveries",
            "collection_recovery_fee"
    );

    for (String columnName : columnsToCast) {
        transformedDF = transformedDF.withColumn(columnName, col(columnName).cast("float"));
    }

    //transformedDF.show(5);
    transformedDF.printSchema();
Output:
    root
     |-- id: string (nullable = true)
     |-- term: integer (nullable = true)
     |-- acc_now_delinq: integer (nullable = true)
     |-- annual_inc: float (nullable = true)
     |-- application_type: integer (nullable = true)
     |-- dti: float (nullable = true)
     |-- installment: float (nullable = true)
     |-- int_rate: float (nullable = true)
     |-- loan_amnt: float (nullable = true)
     |-- funded_amnt: float (nullable = true)
     |-- loan_status: string (nullable = true)
     |-- tax_liens: float (nullable = true)
     |-- delinq_amnt: float (nullable = true)
     |-- policy_code: float (nullable = true)
     |-- last_fico_range_high: float (nullable = true)
     |-- last_fico_range_low: float (nullable = true)
     |-- recoveries: float (nullable = true)
     |-- collection_recovery_fee: float (nullable = true)
     |-- verification_status_encoded: integer (nullable = false)
     |-- grade_index: double (nullable = false)
     |-- purpose_encoded: vector (nullable = true)
     |-- addr_state_encoded: vector (nullable = true)
     |-- home_ownership_encoded: vector (nullable = true)
     |-- initial_list_status_encoded: vector (nullable = true)
Encode ‘loan_status’ to 0 & 1, rename ‘loan_status’ to target and cast to Int.
transformedDF.groupBy("loan_status").count().show();
Output:
    +--------------------+-------+
    |         loan_status|  count|
    +--------------------+-------+
    |          Fully Paid|1076218|
    |             Default|     40|
    |     In Grace Period|   8427|
    |Does not meet the...|   1913|
    |         Charged Off| 268452|
    |  Late (31-120 days)|  21443|
    |             Current| 877018|
    |Does not meet the...|    741|
    |   Late (16-30 days)|   4344|
    +--------------------+-------+
Filter out rows where loan_status is 'Current' and Group by loan_status and count, then show the result.
     transformedDF = transformedDF.filter(col("loan_status").notEqual("Current"));
     transformedDF.groupBy("loan_status").count().show();
Output:
    +--------------------+-------+
    |         loan_status|  count|
    +--------------------+-------+
    |          Fully Paid|1076218|
    |             Default|     40|
    |     In Grace Period|   8427|
    |Does not meet the...|   1913|
    |         Charged Off| 268452|
    |  Late (31-120 days)|  21443|
    |Does not meet the...|    741|
    |   Late (16-30 days)|   4344|
    +--------------------+-------+
transformedDF = transformedDF.withColumn("target",
when(col("loan_status").equalTo("Fully Paid"), 0)
.when(col("loan_status").isin("In Grace Period"), 0)
.when(col("loan_status").equalTo("Does not meet the credit policy. Status:Fully Paid"), 0)
.when(
col("loan_status").isin(
"Does not meet the credit policy. Status:Charged Off",
"Charged Off",
"Late (16-30 days)",
"Late (31-120 days)",
"Default"
),
1
)
.otherwise(null)
)
.drop("loan_status");
// Filter out rows where 'target' is null and cast 'target' to int
transformedDF = transformedDF.filter(col("target").isNotNull())
.withColumn("target", col("target").cast("int"));
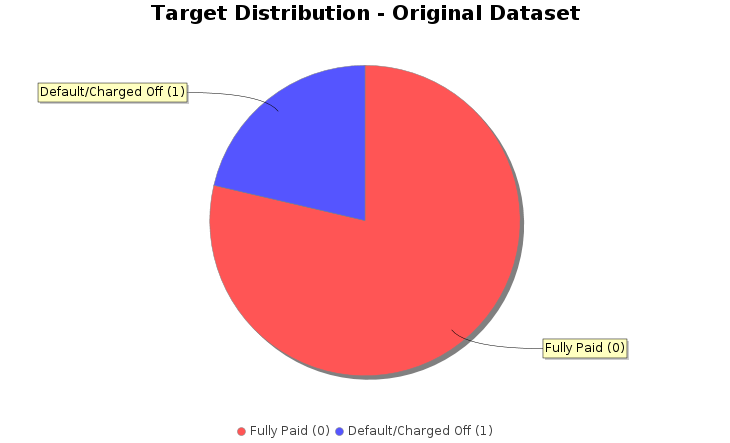
transformedDF.groupBy("target").count().show();
Output:
    +------+-------+
    |target|  count|
    +------+-------+
    |     1| 295020|
    |     0|1086558|
    +------+-------+
    DefaultPieDataset dataset = new DefaultPieDataset();
    dataset.setValue("Fully Paid (0)", 1086558);
    dataset.setValue("Default/Charged Off (1)", 295020);

    // Create chart
    JFreeChart chart = ChartFactory.createPieChart(
            "Target Distribution - Original Dataset",  // Chart title
            dataset,                                  // Data
            true,                                     // Include legend
            true,                                     // Include tooltips
            false                                     // No URLs
    );

    // Customize colors
    chart.setBackgroundPaint(Color.white);
    PieDataset pieDataset = (PieDataset) dataset;
    chart.getPlot().setBackgroundPaint(Color.white);
    chart.getPlot().setOutlineVisible(false);

    // Set custom colors for slices
    java.awt.Paint[] colors = {
            new Color(135, 206, 250), // skyblue
            new Color(240, 128, 128)  // lightcoral
    };
    org.jfree.chart.plot.PiePlot plot = (org.jfree.chart.plot.PiePlot) chart.getPlot();
    for (int i = 0; i < colors.length; i++) {
        plot.setSectionPaint(i, colors[i]);
    }

    // Display the chart
    ChartFrame frame = new ChartFrame("Pie Chart", chart);
    frame.pack();
    frame.setSize(730, 480);
    frame.setVisible(true);
    // drop id
    transformedDF = transformedDF.drop("id");
    transformedDF.show(3);
Output:
    +----+--------------+----------+----------------+-----+-----------+--------+---------+-----------+---------+-----------+-----------+--------------------+-------------------+----------+-----------------------+---------------------------+-----------+---------------+------------------+----------------------+---------------------------+------+
    |term|acc_now_delinq|annual_inc|application_type|  dti|installment|int_rate|loan_amnt|funded_amnt|tax_liens|delinq_amnt|policy_code|last_fico_range_high|last_fico_range_low|recoveries|collection_recovery_fee|verification_status_encoded|grade_index|purpose_encoded|addr_state_encoded|home_ownership_encoded|initial_list_status_encoded|target|
    +----+--------------+----------+----------------+-----+-----------+--------+---------+-----------+---------+-----------+-----------+--------------------+-------------------+----------+-----------------------+---------------------------+-----------+---------------+------------------+----------------------+---------------------------+------+
    |  36|             0|   55000.0|               1| 5.91|     123.03|   13.99|   3600.0|     3600.0|      0.0|        0.0|        1.0|               564.0|              560.0|       0.0|                    0.0|                          1|        2.0| (13,[0],[1.0])|    (50,[6],[1.0])|         (5,[0],[1.0])|              (1,[0],[1.0])|     0|
    |  36|             0|   65000.0|               1|16.06|     820.28|   11.99|  24700.0|    24700.0|      0.0|        0.0|        1.0|               699.0|              695.0|       0.0|                    0.0|                          1|        2.0| (13,[6],[1.0])|   (50,[47],[1.0])|         (5,[0],[1.0])|              (1,[0],[1.0])|     0|
    |  60|             0|   63000.0|               0|10.78|     432.66|   10.78|  20000.0|    20000.0|      0.0|        0.0|        1.0|               704.0|              700.0|       0.0|                    0.0|                          1|        1.0| (13,[2],[1.0])|    (50,[4],[1.0])|         (5,[0],[1.0])|              (1,[0],[1.0])|     0|
    +----+--------------+----------+----------------+-----+-----------+--------+---------+-----------+---------+-----------+-----------+--------------------+-------------------+----------+-----------------------+---------------------------+-----------+---------------+------------------+----------------------+---------------------------+------+
    only showing top 3 rows
Split the data into training and test sets (20% held out for testing)
    Dataset<Row>[] splits = transformedDF.randomSplit(new double[]{0.8, 0.2}, 42L);
    Dataset<Row> trainDF = splits[0];
    Dataset<Row> testDF = splits[1];

    System.out.printf("\nTraining set: %d rows%n", trainDF.count());
    System.out.printf("Test set: %d rows%n", testDF.count());
Output:
    Training set: 1105548 rows
    Test set: 276030 rows
VectorAssembler, MinMaxScaler and Create VectorAssembler to combine features
    // Get all columns
    String[] allColumns = transformedDF.columns();

    // Create feature_columns list, excluding 'target'
    List<String> featureColumns = new ArrayList<>();
    for (String colName : allColumns) {
        if (!colName.equals("target")) {
            featureColumns.add(colName);
        }
    }

    // Create VectorAssembler
    VectorAssembler assembler = new VectorAssembler()
            .setInputCols(featureColumns.toArray(new String[0]))
            .setOutputCol("rawFeatures");

    // Create MinMaxScaler
    MinMaxScaler scaler = new MinMaxScaler()
            .setInputCol("rawFeatures")
            .setOutputCol("features");
7. Classification
Decision tree classifier
    // Create DecisionTreeClassifier
    DecisionTreeClassifier dt = new DecisionTreeClassifier()
            .setLabelCol("target")
            .setFeaturesCol("features");

    // Create Pipeline
    Pipeline dtPipeline = new Pipeline()
            .setStages(new PipelineStage[]{
                    assembler,
                    scaler,
                    dt
            });
    // Train the model (this runs all stages: assembler, scaler, and DecisionTreeClassifier)
    PipelineModel dtModel = dtPipeline.fit(trainDF);

    // Make predictions on the test set
    Dataset<Row> dtPredictions = dtModel.transform(testDF);

    // Select and show example rows
    dtPredictions.select("prediction", "target", "features").show(5);
Output:
    +----------+------+--------------------+
    |prediction|target|            features|
    +----------+------+--------------------+
    |       0.0|     1|(87,[2,4,5,6,7,8,...|
    |       0.0|     0|(87,[2,4,5,6,7,8,...|
    |       1.0|     1|(87,[2,4,5,6,7,8,...|
    |       1.0|     1|(87,[2,4,5,6,7,8,...|
    |       0.0|     0|(87,[2,4,5,6,7,8,...|
    +----------+------+--------------------+
    only showing top 5 rows
    MulticlassClassificationEvaluator dtevaluator = new MulticlassClassificationEvaluator()
            .setLabelCol("target")
            .setPredictionCol("prediction")
            .setMetricName("accuracy");

    double dtAccuracy = dtevaluator.evaluate(dtPredictions);

    // Evaluate F1-score
    dtevaluator.setMetricName("f1");
    double dtF1 = dtevaluator.evaluate(dtPredictions);

    // Calculate precision and recall for class 1.0
    Dataset<Row> predictionAndLabels = dtPredictions.select("prediction", "target");
    JavaRDD<Tuple2>Double, Double>> predictionAndLabelsRDD = predictionAndLabels.toJavaRDD()
            .map(row -> {
                double prediction = row.isNullAt(0) ? 0.0 : ((Number) row.get(0)).doubleValue();
                double target = row.isNullAt(1) ? 0.0 : ((Number) row.get(1)).doubleValue();
                return new Tuple2<>(prediction, target);
            });


    MulticlassMetrics dtMetrics = new MulticlassMetrics(predictionAndLabelsRDD.rdd());

    double dtPrecision = dtMetrics.precision(1.0); // Precision for class 1
    double dtRecall = dtMetrics.recall(1.0);        // Recall for class 1

    // Print evaluation metrics
    System.out.println("Decision tree Evaluation Metrics:");
    System.out.printf("Accuracy: %.4f%n", dtAccuracy);
    System.out.printf("F1-Score: %.4f%n", dtF1);
    System.out.printf("Precision (Class 1): %.4f%n", dtPrecision);
    System.out.printf("Recall (Class 1): %.4f%n", dtRecall);

    // Show confusion matrix
    System.out.println("Confusion Matrix:");
    Matrix confusionMatrix = dtMetrics.confusionMatrix();
    System.out.println(confusionMatrix.toString());
Output:
    Decision tree Evaluation Metrics:
    Accuracy: 0.9384
    F1-Score: 0.9376
    Precision (Class 1): 0.8824
    Recall (Class 1): 0.8206
    Confusion Matrix:
    210698.0  6441.0
    10565.0   48326.0
Random forest classifier
    // Create RandomForestClassifier
    RandomForestClassifier rf = new RandomForestClassifier()
            .setLabelCol("target")
            .setFeaturesCol("features")
            .setNumTrees(100)
            .setSeed(42L)
            .setMaxDepth(10);
    // Create Pipeline
    Pipeline rfPipeline = new Pipeline()
            .setStages(new PipelineStage[]{
                    assembler,  // VectorAssembler
                    scaler,     // MinMaxScaler
                    rf          // RandomForestClassifier
            });
    // Train the model (this runs all stages: assembler, scaler, and RandomForestClassifier)
    PipelineModel rfModel = rfPipeline.fit(trainDF);

    // Make predictions on the test set
    Dataset<Row> rfPredictions = rfModel.transform(testDF);

    // Select and show example rows
    System.out.println("Sample predictions:");
    rfPredictions.select("prediction", "target", "probability", "features").show(5);
    Sample predictions:
    +----------+------+--------------------+--------------------+
    |prediction|target|         probability|            features|
    +----------+------+--------------------+--------------------+
    |       0.0|     1|[0.95993771000454...|(87,[2,4,5,6,7,8,...|
    |       0.0|     0|[0.95840622841043...|(87,[2,4,5,6,7,8,...|
    |       1.0|     1|[0.03913571604884...|(87,[2,4,5,6,7,8,...|
    |       1.0|     1|[0.41940760453938...|(87,[2,4,5,6,7,8,...|
    |       0.0|     0|[0.94800374472084...|(87,[2,4,5,6,7,8,...|
    +----------+------+--------------------+--------------------+
    only showing top 5 rows
    MulticlassClassificationEvaluator rfevaluator = new MulticlassClassificationEvaluator()
            .setLabelCol("target")
            .setPredictionCol("prediction")
            .setMetricName("accuracy");

    double rfAccuracy = rfevaluator.evaluate(rfPredictions);

    // Evaluate F1-score
    rfevaluator.setMetricName("f1");
    double rfF1 = rfevaluator.evaluate(rfPredictions);

    // Calculate precision and recall for class 1.0
    Dataset<Row> predictionAndLabels = rfPredictions.select("prediction", "target");
    JavaRDD<Tuple2>Double, Double>> predictionAndLabelsRDD = predictionAndLabels.toJavaRDD()
            .map(row -> {
                double prediction = row.isNullAt(0) ? 0.0 : ((Number) row.get(0)).doubleValue();
                double target = row.isNullAt(1) ? 0.0 : ((Number) row.get(1)).doubleValue();
                return new Tuple2<>(prediction, target);
            });


    MulticlassMetrics rfMetrics = new MulticlassMetrics(predictionAndLabelsRDD.rdd());

    double rfPrecision = rfMetrics.precision(1.0); // Precision for class 1
    double rfRecall = rfMetrics.recall(1.0);        // Recall for class 1

    // Print evaluation metrics
    System.out.println("RandomForest Evaluation Metrics:");
    System.out.printf("Accuracy: %.4f%n", rfAccuracy);
    System.out.printf("F1-Score: %.4f%n", rfF1);
    System.out.printf("Precision (Class 1): %.4f%n", rfPrecision);
    System.out.printf("Recall (Class 1): %.4f%n", rfRecall);

    // Show confusion matrix
    System.out.println("Confusion Matrix:");
    Matrix confusionMatrix = rfMetrics.confusionMatrix();
    System.out.println(confusionMatrix.toString());
Output:
    RandomForest Evaluation Metrics:
    Accuracy: 0.9411
    F1-Score: 0.9391
    Precision (Class 1): 0.9335
    Recall (Class 1): 0.7793
    Confusion Matrix:
    213868.0  3271.0
    12996.0   45895.0
Gradient Boosted Tree (GBT) Classifier
    // Create GBTClassifier
    GBTClassifier gbt = new GBTClassifier()
            .setLabelCol("target")
            .setFeaturesCol("features")
            .setMaxIter(10)          // Number of trees (iterations)
            .setSeed(42L)
            .setMaxDepth(10);        // Maximum depth of each tree

    // Create Pipeline
    Pipeline gbtPipeline = new Pipeline()
            .setStages(new PipelineStage[]{
                    assembler,  // VectorAssembler
                    scaler,     // MinMaxScaler
                    gbt         // GBTClassifier
            });
    // Train the model using the pipeline on the training DataFrame
    PipelineModel gbtModel = gbtPipeline.fit(trainDF);
    Dataset<Row> gbtPredictions = gbtModel.transform(testDF);
    System.out.println("Sample predictions:");
    gbtPredictions.select("prediction", "target", "probability", "features").show(5);
Output:
    Sample predictions:
    +----------+------+--------------------+--------------------+
    |prediction|target|         probability|            features|
    +----------+------+--------------------+--------------------+
    |       0.0|     1|[0.92418817944213...|(87,[2,4,5,6,7,8,...|
    |       0.0|     0|[0.91588299144270...|(87,[2,4,5,6,7,8,...|
    |       1.0|     1|[0.06587782434719...|(87,[2,4,5,6,7,8,...|
    |       1.0|     1|[0.19597433271823...|(87,[2,4,5,6,7,8,...|
    |       0.0|     0|[0.91090162460587...|(87,[2,4,5,6,7,8,...|
    +----------+------+--------------------+--------------------+
    only showing top 5 rows
    MulticlassClassificationEvaluator gbtevaluator = new MulticlassClassificationEvaluator()
            .setLabelCol("target")
            .setPredictionCol("prediction")
            .setMetricName("accuracy");
    double gbtAccuracy = gbtevaluator.evaluate(gbtPredictions);
    // Evaluate F1-score
    gbtevaluator.setMetricName("f1");
    double gbtF1 = gbtevaluator.evaluate(gbtPredictions);
    // Calculate precision and recall for class 1.0
    Dataset<Row> predictionAndLabels = gbtPredictions.select("prediction", "target");
    JavaRDD<Tuple2<Double, Double>> predictionAndLabelsRDD = predictionAndLabels.toJavaRDD()
            .map(row -> {
                double prediction = row.isNullAt(0) ? 0.0 : ((Number) row.get(0)).doubleValue();
                double target = row.isNullAt(1) ? 0.0 : ((Number) row.get(1)).doubleValue();
                return new Tuple2<>(prediction, target);
            });
    MulticlassMetrics gbtMetrics = new MulticlassMetrics(predictionAndLabelsRDD.rdd());
    double gbtPrecision = gbtMetrics.precision(1.0); // Precision for class 1
    double gbtRecall = gbtMetrics.recall(1.0);        // Recall for class 1
    System.out.println("Gradient Boosting Evaluation Metrics:");
    System.out.printf("Accuracy: %.4f%n", gbtAccuracy);
    System.out.printf("F1-Score: %.4f%n", gbtF1);
    System.out.printf("Precision (Class 1): %.4f%n", gbtPrecision);
    System.out.printf("Recall (Class 1): %.4f%n", gbtRecall);
    // Show confusion matrix
    System.out.println("Confusion Matrix:");
    Matrix confusionMatrix = gbtMetrics.confusionMatrix();
    System.out.println(confusionMatrix.toString());
    Gradient Boosting Evaluation Metrics:
    Accuracy: 0.9438
    F1-Score: 0.9427
    Precision (Class 1): 0.9096
    Recall (Class 1): 0.8180
    Confusion Matrix:
    212354.0  4785.0
    10716.0   48175.0
8. Analysis of Classifier Results
Our three classifiers show strong but slightly varying performance:
- Decision Tree: Accuracy 0.9384
- Random Forest: Accuracy 0.9411
- Gradient Boosting (GBT): Accuracy 0.9438 (Best)
-
Risk of Overfitting or Underfitting.
A model may perform well on one particular split but poorly on others. Cross-validation checks performance across multiple folds, reducing split-bias. -
More Reliable Model Comparison
Comparing DT, RF, and GBT on a single split may give misleading rankings. CV gives an average performance, making the comparison statistically stronger. -
Better Hyperparameter Tuning.
CV is essential for tuning learning rate, depth, tree count, and other parameters. Without CV, tuned parameters might be overfitted to a single test split.
Since Gradient Boosting (GBT) performs best among the three, it is the most suitable classifier for cross-validation.
Cross-Validation of Gradient Boosted Tree (GBT) Classifier
    ParamGridBuilder gbtParamGridBuilder = new ParamGridBuilder()
            .addGrid(gbt.maxDepth(), new int[]{3, 6, 8})
            .addGrid(gbt.maxIter(), new int[]{20, 50});

    ParamMap[] gbtParamGrid = gbtParamGridBuilder.build();
    MulticlassClassificationEvaluator gbtCVEvaluator = new MulticlassClassificationEvaluator()
            .setLabelCol("target")
            .setPredictionCol("prediction")
            .setMetricName("accuracy");
    CrossValidator gbtCV = new CrossValidator()
            .setEstimator(gbtPipeline)
            .setEvaluator(gbtCVEvaluator)
            .setEstimatorParamMaps(gbtParamGrid)
            .setNumFolds(5)
            .setSeed(42L); // Optional: for reproducibility
    CrossValidatorModel gbtCVModel = gbtCV.fit(trainDF);
    Dataset<Row> gbtCVPredictions = gbtCVModel.transform(testDF);
    System.out.println("Sample predictions from cross-validated model:");
    gbtCVPredictions.select("prediction", "target", "features").show(5);
Output:
    Sample predictions from cross-validated model:
    +----------+------+--------------------+
    |prediction|target|            features|
    +----------+------+--------------------+
    |       0.0|     1|(87,[2,4,5,6,7,8,...|
    |       0.0|     0|(87,[2,4,5,6,7,8,...|
    |       1.0|     1|(87,[2,4,5,6,7,8,...|
    |       1.0|     1|(87,[2,4,5,6,7,8,...|
    |       0.0|     0|(87,[2,4,5,6,7,8,...|
    +----------+------+--------------------+
    only showing top 5 rows
    MulticlassClassificationEvaluator gbtCVevaluator = new MulticlassClassificationEvaluator()
            .setLabelCol("target")
            .setPredictionCol("prediction")
            .setMetricName("accuracy");

    double gbtCVAccuracy = gbtCVevaluator.evaluate(gbtCVPredictions);

    gbtCVevaluator.setMetricName("f1");
    double gbtCVF1 = gbtCVevaluator.evaluate(gbtCVPredictions);

    Dataset<Row> predictionAndLabels = gbtCVPredictions.select("prediction", "target");
    JavaRDD<Tuple2>Double, Double>> predictionAndLabelsRDD = predictionAndLabels.toJavaRDD()
            .map(row -> {
                double prediction = row.isNullAt(0) ? 0.0 : ((Number) row.get(0)).doubleValue();
                double target = row.isNullAt(1) ? 0.0 : ((Number) row.get(1)).doubleValue();
                return new Tuple2<>(prediction, target);
            });

    MulticlassMetrics gbtCVMetrics = new MulticlassMetrics(predictionAndLabelsRDD.rdd());

    double gbtCVPrecision = gbtCVMetrics.precision(1.0);
    double gbtCVRecall = gbtCVMetrics.recall(1.0);

    System.out.println("GBT Classifier Cross-Validationn Evaluation Metrics:");
    System.out.printf("Accuracy: %.4f%n", gbtCVAccuracy);
    System.out.printf("F1-Score: %.4f%n", gbtCVF1);
    System.out.printf("Precision (Class 1): %.4f%n", gbtCVPrecision);
    System.out.printf("Recall (Class 1): %.4f%n", gbtCVRecall);

    System.out.println("Confusion Matrix:");
    Matrix confusionMatrix = gbtCVMetrics.confusionMatrix();
    System.out.println(confusionMatrix.toString());
Output:
    GBT Classifier Cross-Validation Evaluation Metrics:
    Accuracy: 0.9446
    F1-Score: 0.9435
    Precision (Class 1): 0.9118
    Recall (Class 1): 0.8196
    Confusion Matrix:
    212471.0  4668.0
    10621.0   48270.0
9. Summary of Model Performance
The evaluation of the Decision Tree, Random Forest, and Gradient-Boosted Tree (GBT) classifiers on the loan default
prediction task reveals strong performance across all models, with GBT (with cross-validation) achieving the best overall results.
Key Findings
-
Decision Tree:
- Accuracy: 0.9384
- F1-Score: 0.9376
- Precision (Class 1): 0.8824
- Recall (Class 1): 0.8206
- The model performs well but struggles slightly with false positives (6,441) and false negatives (10,565), indicating room for improvement in balancing precision and recall for the default class.
-
Random Forest:
- Accuracy: 0.9411
- F1-Score: 0.9391
- Precision (Class 1): 0.9335
- Recall (Class 1): 0.7793
- Improved precision for the default class, but recall dropped, leading to more false negatives (12,996). This suggests the model is more conservative in predicting defaults.
-
Gradient-Boosted Tree (GBT):
- Accuracy: 0.9438
- F1-Score: 0.9427
- Precision (Class 1): 0.9096
- Recall (Class 1): 0.8180
- GBT outperforms the decision tree, with better precision and recall balance, reducing both false positives (4,785) and false negatives (10,716).
-
GBT with Cross-Validation:
- Accuracy: 0.9446
- F1-Score: 0.9435
- Precision (Class 1): 0.9118
- Recall (Class 1): 0.8196
- The best-performing model, achieving the highest accuracy and F1-score. Cross-validation helped fine-tune hyperparameters, resulting in the lowest error rates.
- True Negatives (Non-Defaults): All models correctly identify the majority of non-default cases (~210K–213K).
- False Positives: GBT (with CV) minimizes false positives (4,668), reducing unnecessary alerts for non-default loans.
- False Negatives: GBT (with CV) also minimizes false negatives (10,621), ensuring fewer actual defaults are missed.
GBT with Cross-Validation is the best model for deployment due to its superior balance of precision and recall, as well as the highest overall accuracy.
Thanks

Image:freepik